Sellers or buyers housing market? Zillow’s analysis for 250 metros

[Images: Lance Lambert]
Want more housing market stories from Lance Lambert’s ResiClub in your inbox? Subscribe to the ResiClub newsletter.
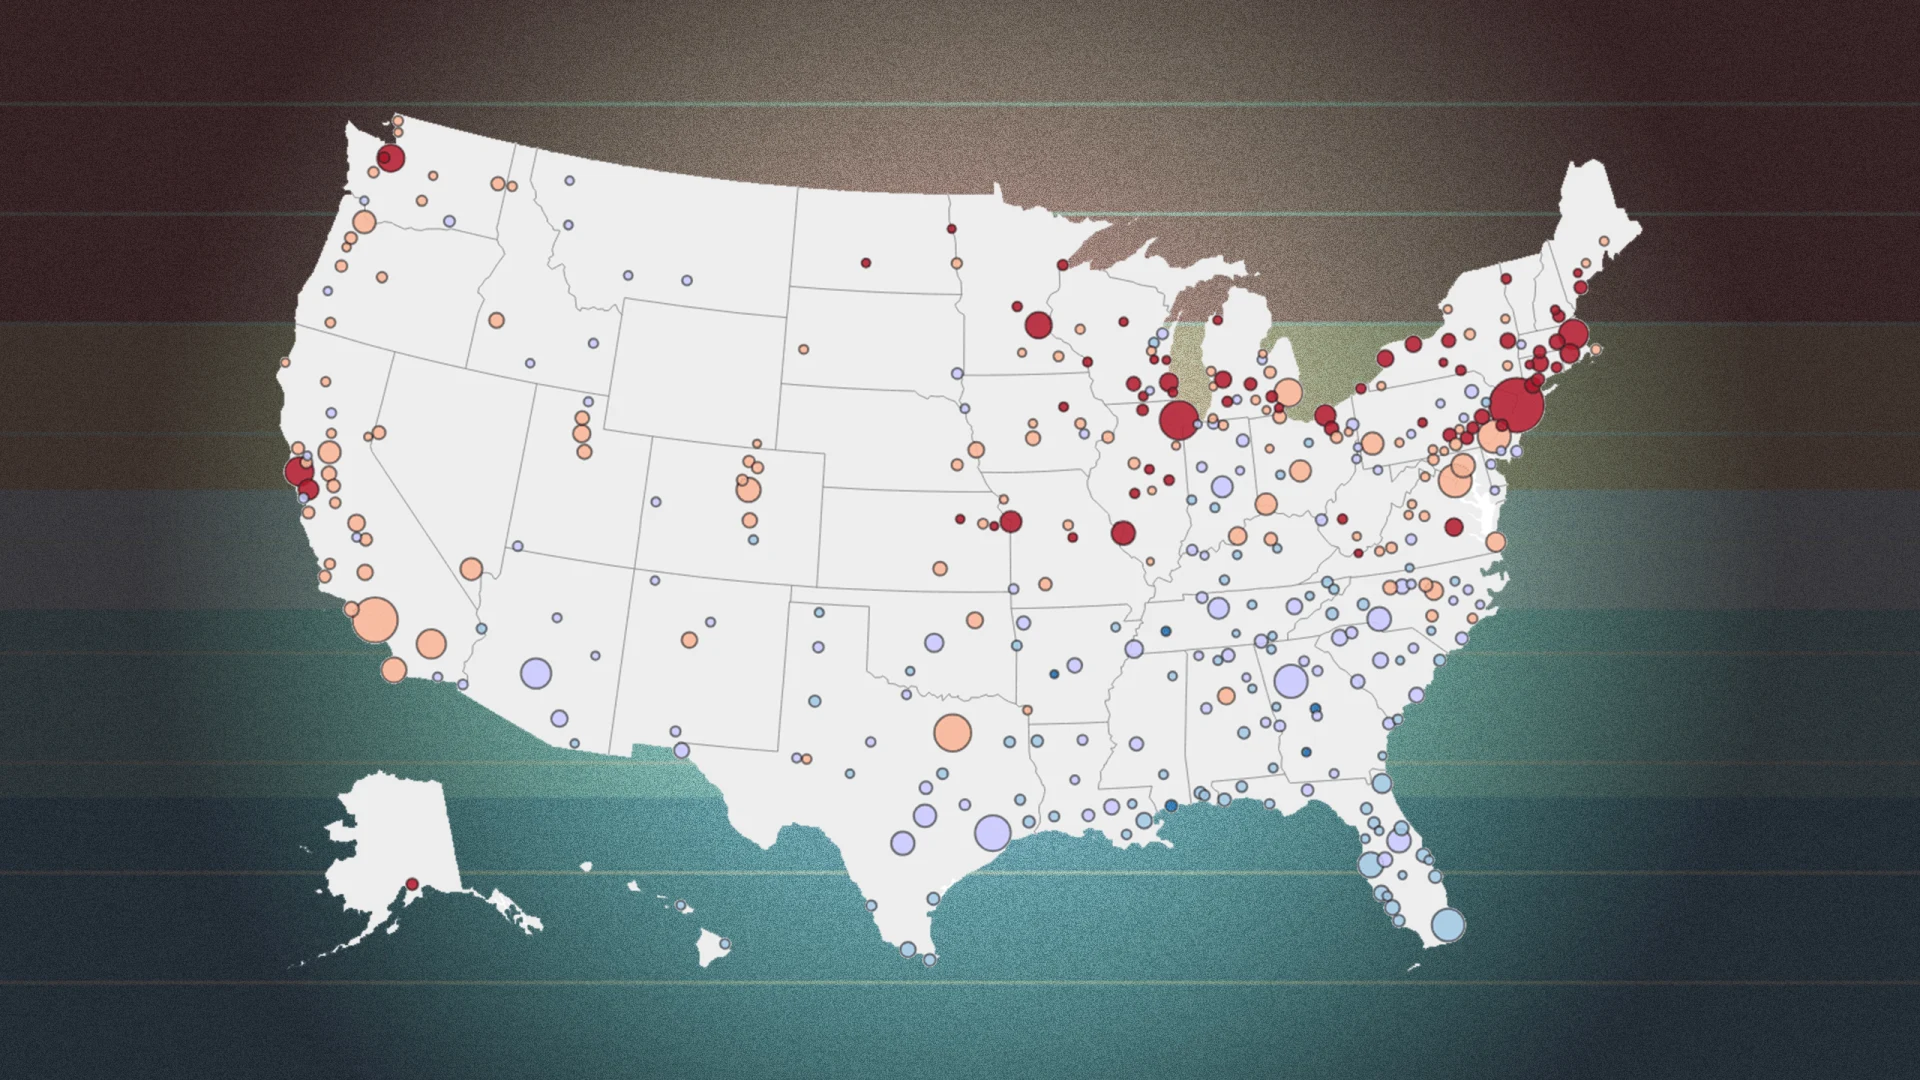
Zillow economists have an economic model known as the Zillow Market Heat Index to gauge the competitiveness of housing markets across the country. This model looks at key indicators—including home price changes, inventory levels, and days on market—to generate a score showing whether a market favors sellers or buyers.
A higher score indicates a hotter metro-level housing market where sellers have more power. A lower score indicates a colder metro-level housing market where buyers have more power. According to Zillow, a score of 70 or above is a strong sellers market, and a score from 55 to 69 is a sellers market. A score of 44 to 55 indicates a neutral market. A score from 28 to 44 reflects a buyers market, and a score of 27 or below is a strong buyers market.
To read the full story click on the following link. https://www.fastcompany.com/91343006/housing-market-sellers-or-buyers-market-zillow-analysis-for-250-metros
Categories
Recent Posts